

- Your cart is empty Browse Shop

Website Speed Optimization: Make Your Site Faster
Key takeaways
- Website speed optimization starts with measurement: track Largest Contentful Paint, Interaction to Next Paint and Cumulative Layout Shift before changing anything.
- Google's targets are an LCP within 2.5 seconds, an INP of 200 milliseconds or less, and a CLS of 0.1 or less.
- Images and media are usually the heaviest part of a page, so compression and modern formats deliver the fastest wins.
- Caching, a CDN and a faster server response time cut the time before the browser even starts rendering.
- Removing unused scripts and trimming code reduces what the browser has to download, parse and execute.
A slow site costs you visitors and rankings, and fixing it comes down to four things: measuring the right metrics, lightening your images, serving pages from cache and a CDN, and cutting unused code. Website speed optimization is the work of reducing the time it takes a page to become visible and usable, and most of it is practical rather than mysterious.
This guide walks through each step in plain terms. You will learn what to measure, which numbers to aim for, and the specific changes that produce the biggest improvement for the least effort. The order matters: measure first, then fix the heaviest problems, then clean up the rest.

Why page speed affects rankings and conversions
Page speed affects two things at once: how search engines rank you and how many visitors stay long enough to act. Google confirmed that starting in July 2018, page speed became a ranking factor for mobile searches, according to Google Search Central. The effect targets the pages that deliver the slowest experiences, so a sluggish site is the one most at risk.
The conversion side is just as concrete. Google's own work on speeding up the pages it serves from Search produced a meaningful drop in how often people abandoned those visits, with the biggest gains showing up for the slowest traffic. Faster pages keep people around, and people who stay are the ones who buy, sign up or call.
For a local business in Sri Lanka or a brand selling internationally, that translates directly into leads. A visitor who waits several seconds for a product page often leaves before it finishes loading, and you never get a second chance to make that first impression.
Measuring performance with Core Web Vitals
Core Web Vitals are Google's three headline metrics for real-world page experience, and they give you a shared scorecard to aim at. According to Google's web.dev guidance, the targets are a Largest Contentful Paint (LCP) within 2.5 seconds, an Interaction to Next Paint (INP) of 200 milliseconds or less, and a Cumulative Layout Shift (CLS) of 0.1 or less.
Each metric measures something different in everyday terms:
- LCP (loading): how long until the largest visible element, usually a hero image or headline, appears.
- INP (interactivity): how quickly the page responds when someone taps or clicks.
- CLS (visual stability): how much the layout jumps around while the page loads.
Most sites have room to improve. HTTP Archive's Web Almanac 2024 found that 59% of mobile pages achieved a good LCP score, while desktop reached 74%. Looking at all three vitals together, the same report found 43% of mobile websites had good Core Web Vitals, with desktop at 54%. In other words, more than half of mobile sites fail the combined test, so hitting all three targets puts you ahead of the pack.
Start with free tools before you spend anything. PageSpeed Insights and the Core Web Vitals report inside Google Search Console both show these metrics using real visitor data. Run your most important pages first: the homepage, top landing pages and your highest-traffic product or service page.
Compressing images and optimizing media delivery
Images are usually the single heaviest part of a web page, so compressing them is the fastest win in website speed optimization. A photo exported straight from a camera or a design tool can be several megabytes, when the same image resized and compressed for the web might be a tenth of that size with no visible loss in quality.
Work through media in this order:
- Resize to the display size. A banner shown at 1200 pixels wide does not need a 5000-pixel source file.
- Use modern formats. WebP and AVIF produce much smaller files than older JPEG and PNG at the same quality.
- Compress. Run images through a compression step as part of publishing rather than uploading raw files.
- Lazy-load below the fold. Let images further down the page load only as the visitor scrolls toward them.
- Set width and height. Reserving space for each image stops the layout from jumping, which protects your CLS score.
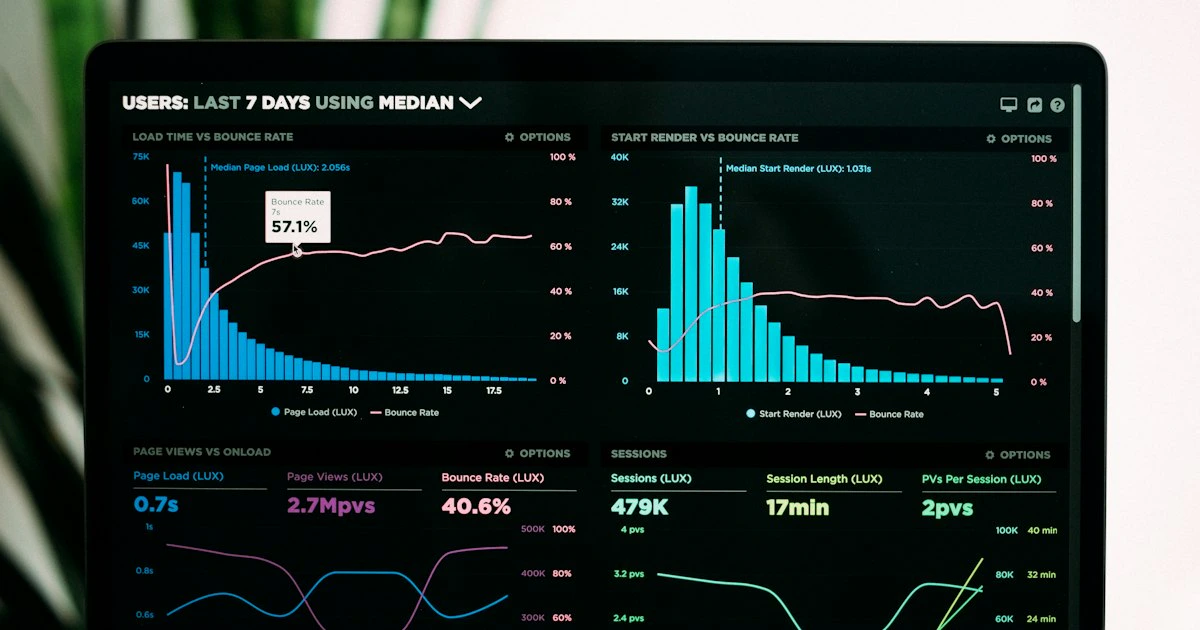
Video deserves the same discipline. Avoid autoplaying heavy background videos on mobile, host video on a service built for streaming rather than serving a raw file, and use a lightweight poster image so the page looks finished before anyone presses play.
Caching, CDNs and reducing server response time
Caching and a content delivery network attack the delay that happens before the browser even starts drawing your page. Server response time, often called Time to First Byte, is how long your hosting takes to send the first piece of a page. If that number is high, every other optimization is building on a slow foundation.
Three levers fix most of this:
- Page caching stores a ready-made version of each page so your server does not rebuild it from scratch on every visit. For a brochure or blog page that rarely changes, this alone can cut response time dramatically.
- A CDN keeps copies of your files on servers around the world. A visitor in Colombo or London is served from a nearby location instead of a single distant origin, which shortens the physical distance data has to travel.
- Better hosting matters when caching is not enough. Shared hosting that buckles under traffic will always feel slow, so a plan sized to your actual visitor numbers is worth the cost.
Your platform choice feeds into all of this, because some systems make caching and global delivery easier than others. If you are still deciding, our comparison of WordPress, Webflow and Shopify walks through how each handles performance and maintenance.
Cleaning up code and unused scripts for faster loads
Cleaning up code reduces what the browser has to download, read and run, which is often where the last stubborn seconds hide. Over time a site accumulates plugins, tracking tags, fonts and scripts that no longer serve a purpose, and each one adds weight the visitor's device has to process.
Focus on the parts that cause the most drag:
- Remove unused scripts and plugins. Every third-party tag, chat widget and analytics snippet costs load time. Keep only what earns its place.
- Minify CSS and JavaScript. Stripping out spaces and comments shrinks files without changing how they work.
- Defer non-essential JavaScript. Let the page show its content first and load secondary scripts afterward.
- Limit web fonts. Each font weight and style is a separate download, so trim to the few you actually use.
There is encouraging news on visual stability as code gets cleaner. HTTP Archive's Web Almanac 2024 reported that 79% of mobile sites have good CLS scores, which shows that the layout-shift problem is one the web has largely learned to manage. Loading and interactivity remain the harder battles, and that is where disciplined code cleanup pays off.
A sensible rhythm is to review your scripts and plugins every few months, remove anything inactive, and re-measure with PageSpeed Insights afterward so you can see the effect of each change.
Putting it into practice
Run a PageSpeed Insights test on your three most important pages this week and write down the LCP, INP and CLS for each. That single baseline tells you whether your next effort belongs in images, server response or code, so you spend time where it actually moves the numbers. If the results look daunting or you would rather hand the work to a team, Uniclkay builds and tunes fast websites for Sri Lankan and international clients, and a quick audit will show you exactly where your speed is leaking.
Frequently asked questions
What is a good page load time?
Aim for a Largest Contentful Paint within 2.5 seconds, which is the point when the main content becomes visible. Core Web Vitals measure the experience more precisely than a single load-time number.
Does website speed actually affect Google rankings?
Yes. Google confirmed page speed became a ranking factor for mobile searches in July 2018, and Core Web Vitals remain part of its page experience signals.
What slows down a website the most?
Large uncompressed images, slow server response times, and heavy or unused JavaScript are the three most common causes. Measuring your site shows which one applies to you.
How do I measure my website speed for free?
Use PageSpeed Insights or the Core Web Vitals report in Google Search Console. Both report real metrics such as LCP, INP and CLS using Google's own thresholds.